

Excel Sales Dashboard Spreadsheet - XLSX
Excel Sales Dashboard Spreadsheet - XLSX
Immediate shipping
code 960160571
$14.95
or 2x of $8.28
By completing this purchase you earn
38 DFG Points
+ 19 bonus DFG Points
Available: 1
Digital delivery
Up to
10 payment methods


Description
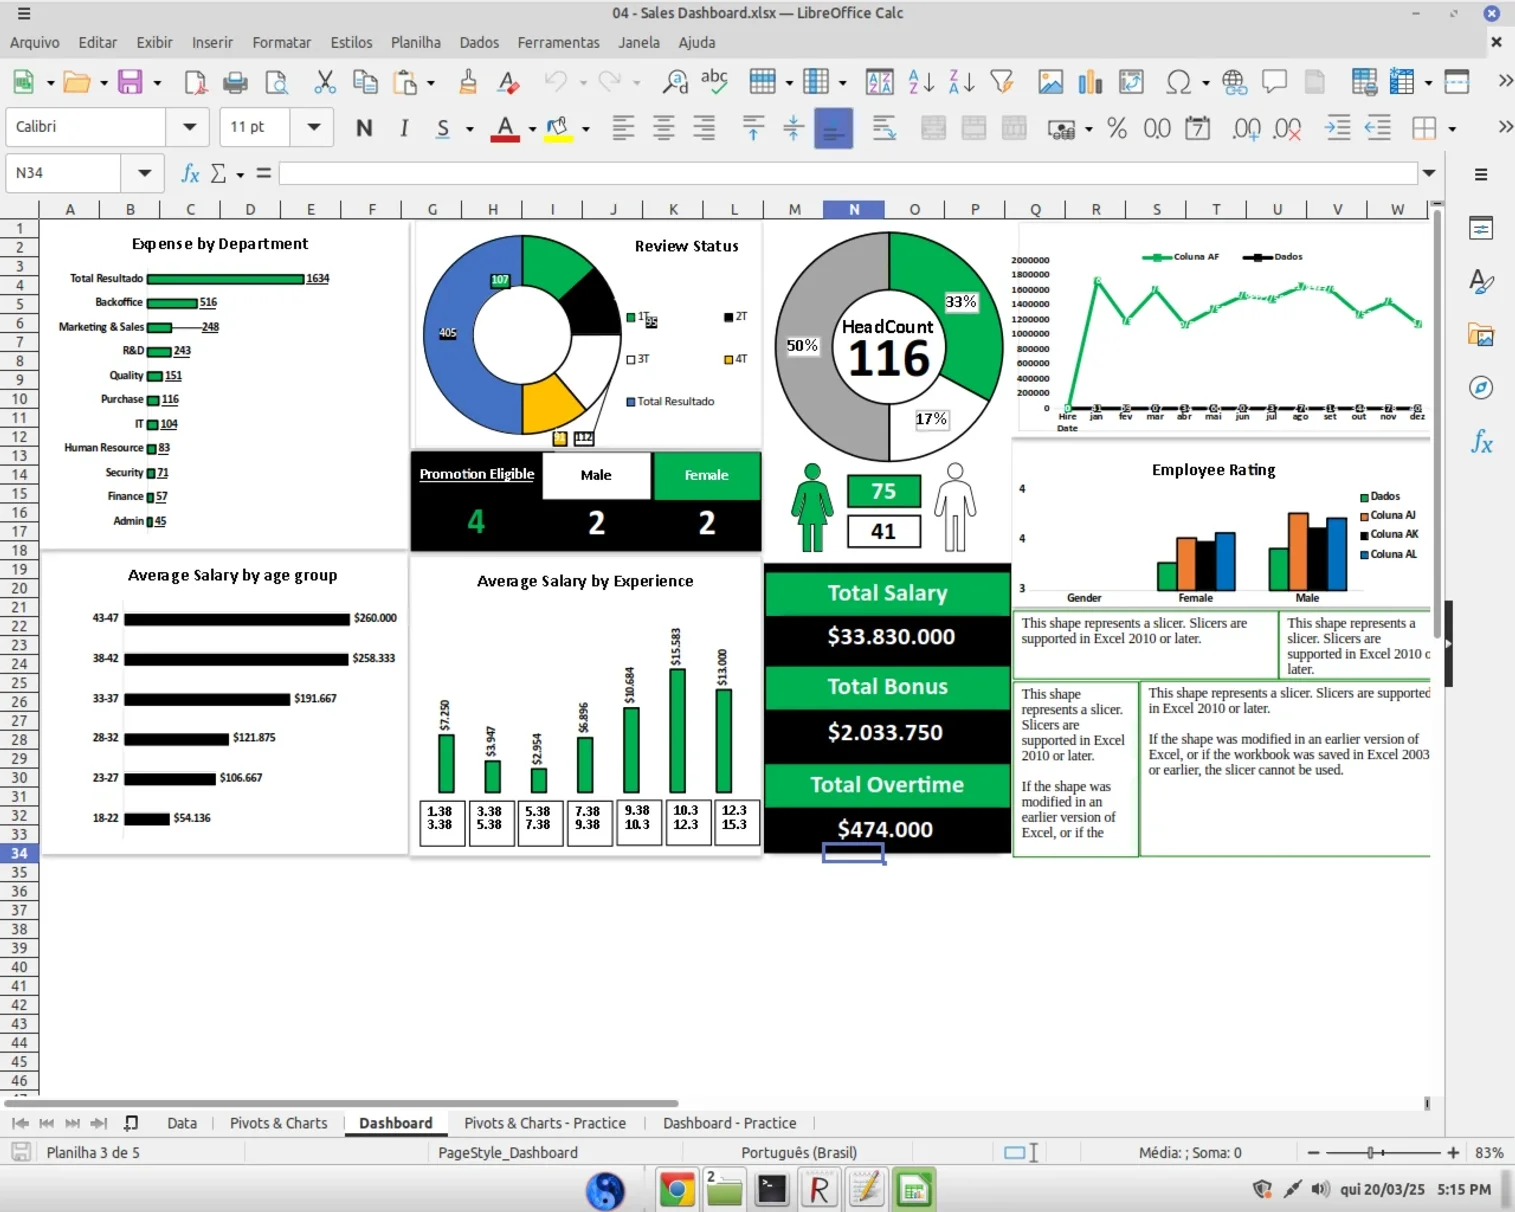
The Sales Dashboard spreadsheet is a data analysis tool that provides an overview of a company's sales. It contains information about employees, their ratings and performance, as well as data about the company's sales and expenses.
**Employee Information**
* **Full Name:** The employee's full name.
* **Gender:** The employee's gender.
* **Age:** The employee's age.
* **Hire Date:** The date the employee was hired.
* **Status:** The employee's current status (active, notice period, sick leave, etc.).
* **Employment Type:** The employee's contract type (FTE - Full Time Employee, FTC - Fixed Term Contract).
* **Department:** The department the employee belongs to.
* **Current Employment Time:** The length of time the employee has currently worked at the company.
* **Total Experience:** The employee's total experience, including previous jobs.
* **Salary:** The employee's monthly salary.
* **Bonus:** The employee's annual bonus.
* **Overtime:** The amount paid in overtime.
* **Total Expense:** The employee's total expense.
* **Efficiency Rating:** The employee's rating of his or her efficiency.
* **Behavior Rating:** The employee's rating of his or her behavior.
* **Innovation Rating:** The employee's rating of his or her ability to innovate.
* **Peer Rating:** The employee's rating of his or her interactions with peers.
* **Average Rating:** The average of the employee's ratings.
* **Promotion Eligible:** Whether the employee is eligible for a promotion.
* **Review Status:** The status of the employee's last performance review.
**How to Use the Spreadsheet**
The spreadsheet can be used to:
* **Analyze employee performance:** The spreadsheet allows you to visualize employee performance across different metrics, such as efficiency, behavior, innovation, and interaction with colleagues.
* **Identify potential employees:** The spreadsheet can be used to identify employees with growth potential who can be considered for promotions.
* **Track sales and expenses:** The spreadsheet provides information about the company's sales and expenses, which can be useful for monitoring the company's financial performance.
* **Create reports:** The spreadsheet can be used to create reports on different aspects of the company's performance, such as employee performance, sales, and expenses.
**Pivots and Charts**
The spreadsheet contains several pivots and charts that can be used to visualize data in a clearer and more intuitive way. For example, you can use pivots to:
* **Visualize employee distribution by department:** You can create a pivot that shows the number of employees in each department.
* **Analyze Employee Performance by Gender:** You can create a pivot chart that shows employee performance by gender.
* **Compare Employee Salary by Age:** You can create a pivot chart that shows employee salary by age.
Charts can be used to:
* **Visualize Sales Growth Over Time:** You can create a line chart that shows your company's sales over time.
* **Compare Employee Performance:** You can create a bar chart that compares employee performance across different metrics.
* **Identify Trends:** You can use charts to identify trends in your data, such as an increase in sales or a decrease in productivity.
**Additional Information**
* The spreadsheet contains data about employees hired on different dates.
* The spreadsheet also contains information about the status of employee performance reviews.
* The spreadsheet can be used to analyze your company's performance across different metrics, such as sales, expenses, and productivity.
**Recommendations**
* It is important to keep the spreadsheet updated with the most recent information.
* The spreadsheet can be used to improve the company's performance by identifying areas for improvement and taking steps to correct problems.
* The spreadsheet can be used to make strategic decisions, such as allocating resources and hiring new employees.
Questions and answers


Secure purchase
We guarantee delivery or refund your money.

Ticket support
Team ready to help you whenever you need.Questions and answers
Ask the seller
Your question is public. Do not share email, phone number or other personal information.
Latest questions
No questions yet. Be the first to ask!
Excel Sales Dashboard Spreadsheet - XLSX
Immediate shipping
code 960160571
By completing this purchase you earn38 DFG Points
+ 19 bonus DFG Points
Available: 1
$14.95
or 2x of $8.28
Digital delivery
Up to
10 payment methods
Secure purchase
We guarantee delivery or refund your money.Ticket support
Team ready to help you whenever you need.Loading your recently viewed items...
Recently viewed
Loading similar products...
Similar products
- Excel - Sales Dashboard Spreadsheet - XLSX Download
- Excel - Sales Dashboard Spreadsheet
- Planilha Excel Call Center Dashboard
- Super Pack PLANILHAS de Excel + de 3500!
- Planilha Excel de Orçamento Doméstico + Dashboard
- Super Pack PLANILHAS de Excel + de 3500! - Entrega Imediata!
- MEGA Pack PLANILHAS de Excel + de 10mil! - Entrega Imediata!
- Pacote De Dashboards Excel + De 150 Modelos Editáveis
- MEGA Pack +15.000 Planilhas Excel Editáveis + BRINDE
- Pack Excel de Planilhas
- Controle Financeiro Dashboard Excel + Bonus Controle Finance
- Planilha Excel Controle Financeiro Pessoal


